
Your Model is Never 100% Certain. Here’s How to Measure Its Confidence.
A single prediction is nothing but a risky gamble. To make solid decisions, you need confidence intervals — a statistical powerhouse that transforms uncertainty into reliable insights. If you’re skipping this step, you’re sabotaging your models. Here’s how to fix it.
🌟 What is a Confidence Interval?
A confidence interval is a range of values that likely contains the true population parameter (e.g., the actual average recovery time for all patients).
✅ Instead of: “The average recovery time is 14 days.”
✅ You say: “We’re 95% confident the true recovery time is between 12 and 16 days.”
What it tells you:
✅ How much uncertainty exists in your estimate.
✅ How precise your prediction is.
✅ Whether your sample data is reliable.
💡 Enjoying this?
Subscribe for more thoughts on [Business Analysis | ML | Product Development]. Don’t miss out on the next one!
📊 How Confidence Intervals Work (Step-by-Step)
Let’s break down the process with an example.
Choose a Confidence Level (Usually 95%)
If you repeat the experiment 100 times, the true value will fall within the interval about 95 times.Calculate the Margin of Error
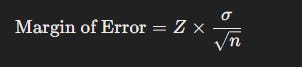
Depends on sample size, standard deviation, and the critical z-score (1.96 for 95%).
Formula:

Where:
Z = Z-score corresponding to your confidence level (1.96 for 95%)
σ = Standard deviation
n = Sample size
Compute the Confidence Interval
Lower bound = Sample Mean − Margin of Error
Upper bound = Sample Mean + Margin of Error
Example:
Average height = 5’9”, Standard Deviation = 3 inches, Sample Size = 100
Margin of Error ≈ 0.6 inches
Confidence Interval = (5’8.4” to 5’9.6”)
💡 We are 95% confident the true average height is between 5’8.4” and 5’9.6”
🔍 Why Confidence Intervals Matter in Machine Learning
🚫 Ignoring confidence intervals = trusting unreliable data.
Examples:
🔥 A/B Testing: Comparing conversion rates between two campaigns.
Campaign A: 5.1% (CI: 4.8% - 5.4%)
Campaign B: 4.9% (CI: 4.6% - 5.2%)
Overlapping intervals mean the difference is likely not significant.
📈 Stock Market Forecasting: Predicting stock returns with 6% (CI: 2% - 10%).
A wide interval indicates high uncertainty = riskier investment.
🚗 Self-Driving Car Safety: Predicting accident rates with 1.2 per million miles (CI: 0.8 - 1.6).
If the upper bound exceeds 1.5, safety concerns arise.
🎭 Recommendation Systems: Predicting movie ratings with 4.2 stars (CI: 3.8 - 4.6).
A narrow interval means better personalization.

🚨 Common Misinterpretations to Avoid
❌ “95% confidence means there’s a 95% chance the true value is in this range.”
✅ Wrong. It means that 95% of similar samples would capture the true value.
❌ “A 99% confidence interval is always better than a 95% CI.”
✅ Not necessarily. A 99% CI is wider, meaning more uncertainty in decision-making.
❌ “If two intervals overlap, the difference is always insignificant.”
✅ Not always. Statistical testing may still find significance.
🔥 Key Takeaway:
Confidence intervals don’t give certainty. They quantify uncertainty and empower your predictions. Learn to use them or risk building unreliable models.
Share The Data Cell
🚀 Love reading this? You’d love my site, The Data Cell—where I deep dive into ML, Business Analysis, and everything in between.
💛 If you enjoyed this, share with a friend, and recommend this to others. It helps me more than you know! 🙏
😉