

Decision Trees: The Complete Guide for Business Analysts and Product Managers
Stop building black boxes. A step-by-step guide to using the most interpretable model in machine learning to make smarter, data-driven decisions.
Your data science team just presented their latest model. It predicts customer churn with impressive accuracy.

But when a senior executive asks a simple question—”Which customers are most at risk, and why?”—the room goes quiet. The answer is a vague explanation of “complex feature interactions” and “neural network weights.”
The executive nods, but you see it in their eyes. They don’t trust the model. The insight is dead on arrival, and the company will continue making decisions based on gut feelings and outdated assumptions.
This is the “black box” problem, and it’s the single biggest barrier to creating a truly data-driven culture.
As a Business Analyst or Product Manager, you are stuck in the middle of this communication gap.
But what if you had a tool that was not only powerful but also completely transparent?
What if you could build a model that explains itself, in plain English?
That tool is the Decision Tree, and it’s the ultimate “white box” in machine learning. This guide will teach you a simple framework to master it.
What is a Decision Tree? (And Why It’s Your Secret Weapon)
Forget complex math for a moment. Imagine you’re playing a game of “Guess Who?”.
Each question you ask—”Does your person wear glasses?” or “Do they have brown hair?”—is designed to split the remaining possibilities into smaller, more manageable groups.
You’re strategically dividing the universe of options until you land on a single, confident answer.
A Decision Tree does the exact same thing with your data. It’s a flowchart that asks a series of simple questions to segment a population, with the goal of understanding and predicting behavior.
Its power isn’t just in its accuracy; it’s in its unrivaled clarity. You can literally print it out and show it to someone
The I.D.E. Framework: A Mental Model for Data-Driven Decisions
To truly master Decision Trees, you need to learn to think like one. The algorithm uses complex math like Gini Impurity or Information Gain, but the underlying logic is simple.
I call it the I.D.E. Framework: Identify, Divide, and Evaluate.
Step 1: Identify — Finding the Most Powerful Question
A Decision Tree’s first job is to find the single most powerful question it can ask to split the data.
In business terms, it’s finding the one variable that creates the most separation between outcomes.
Imagine you’re trying to predict which customers will churn. You have data like their monthly price, their tenure, and the number of support tickets they’ve filed.
The algorithm doesn’t guess. It mathematically scores each question (each feature) to see which one creates the most “order” from the “chaos” of your mixed data.
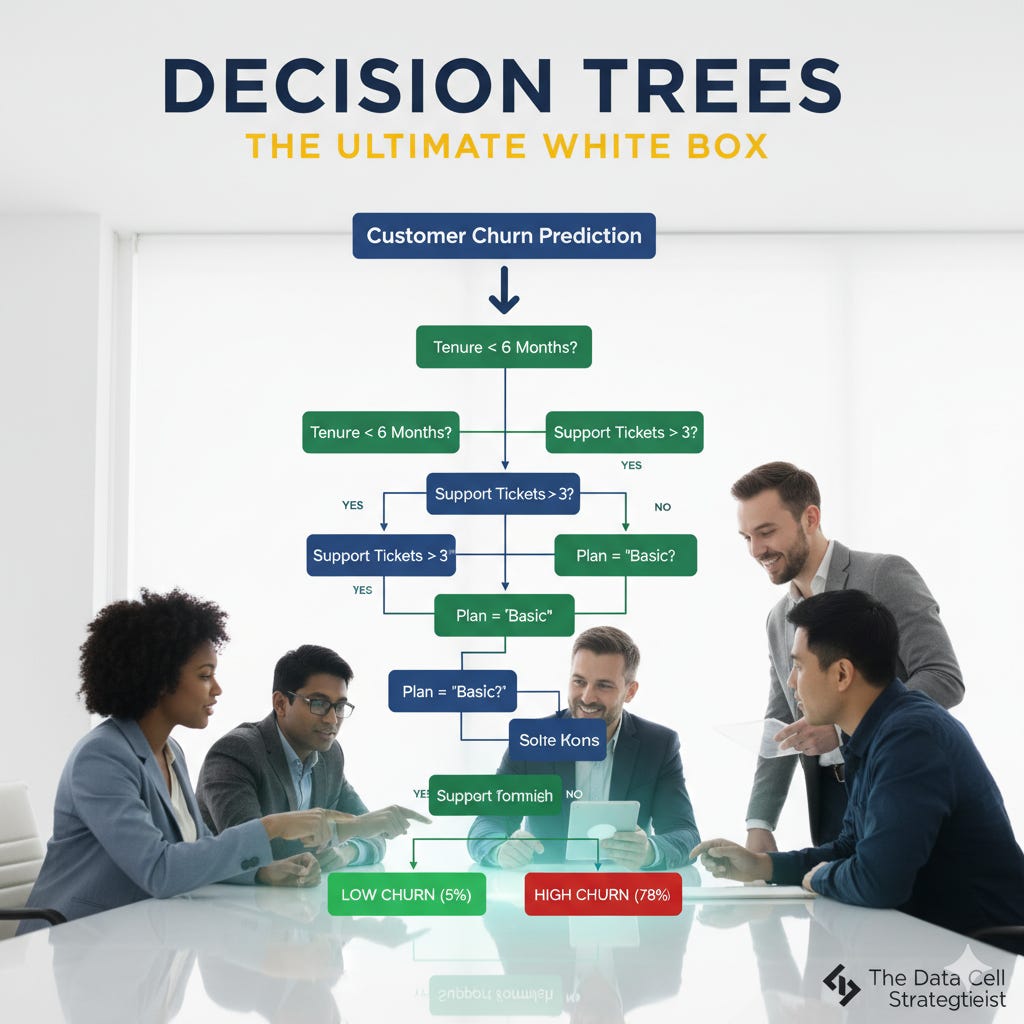
It might find that the question, “Is the customer’s tenure less than 6 months?” does the best job of separating likely-churners from likely-stayers.
Step 2: Divide — Splitting Your Data into Smarter Groups
Once the best question is identified, the tree divides the data into two or more branches.
Branch A: All customers with tenure < 6 months.
Branch B: All customers with tenure >= 6 months.
This is the first “node” of your tree. You’ve now created two new, smaller populations. The goal is for these new groups to be more homogenous, or “purer,” than the original group.
Step 3: Evaluate — Measuring the Clarity of Your New Groups
Now, you look at the results. Let’s say you find that Branch A (new customers) has a churn rate of 45%, while Branch B (veteran customers) has a churn rate of only 5%. You have successfully created clarity.
But the process doesn’t stop.
The algorithm then looks at Branch A and asks, “Okay, for these new customers, what is the next most powerful question we can ask?”
It might be about their subscription plan. It repeats the I.D.E. cycle—Identify, Divide, Evaluate—on each new branch until it reaches a “leaf node,” a final group that is sufficiently pure or too small to split further.
From Theory to Practice: The Stakeholder Communication Playbook
Understanding the I.D.E. framework is only half the battle. Your real job is to use the tree’s output to drive action.
Here are two plug-and-play scripts for communicating the model’s logic to any non-technical stakeholder.
1. The “Explain the Path” Script
Use this when a stakeholder wants to know why the model made a specific prediction.
Scenario: Your model predicts that “Customer XYZ” is a high churn risk. Your Head of Customer Success asks you why.
You say: “According to the model, this customer is at high risk because of three key factors. First, their tenure is less than 6 months. Second, they are on our ‘Basic’ subscription plan. And third, they have contacted customer support more than 3 times in the last month. Customers who match this exact profile have historically churned 78% of the time.”
This script is powerful because it translates the model’s logic into a simple, defensible, step-by-step narrative.
2. The “Surface the Strategy” Script
Use this when you need to present the overall findings from the model to leadership and propose a course of action.
Scenario: You are in a quarterly business review and need to explain what the churn model tells you about your customers.
You say: “The model has identified two key customer segments we need to act on immediately. Our most vulnerable group are new users, specifically those with a tenure under 6 months who are on our ‘Basic’ plan. I propose we launch a targeted onboarding campaign for this cohort.
Conversely, our most loyal customers are long-term users—over 24 months—on the ‘Pro’ plan. We should focus our upselling efforts for the new ‘Enterprise’ features on this group.”
This script moves beyond a single prediction and elevates the model’s logic into a clear, actionable business strategy.
The Two Big Risks: Overfitting and Bias
Decision Trees are powerful, but they are not foolproof. You must be aware of two major risks:
Overfitting: This happens when the tree becomes too complex. It learns the noise and outliers in your training data so perfectly that it fails to generalize to new, unseen data.
Think of it as a student who memorizes the answers to a practice test but can’t solve any new problems. The solution is called “pruning”—simplifying the tree by cutting off the least important branches.Bias: A Decision Tree is only as good as the data it’s trained on. If your historical data contains human biases (e.g., certain demographics received poorer service), the model will learn these patterns and automate them at scale.
It will create a data-driven justification for continuing the biased practices of the past.
A Decision Tree is a tool for clarity. It shines a bright light on the patterns in your data. It’s your job to ensure the patterns it reveals are both statistically sound and ethically responsible.
Supervised learning models can stumble when faced with rare, new patterns never seen in training data, or when the feedback isn’t precise enough.
And gathering enough high-quality, labeled data can be as challenging as teaching a large classroom of diverse students.
From Black Box to Clear Strategy
Mastering Decision Trees is what separates a good Business Analyst or Product Manager from a great one.
It’s how you shift from being a reactive translator of technical jargon to a proactive leader who uses data to build clear, defensible, and actionable strategy.
Every Tuesday, I send out one actionable framework just like this one—designed to help you build influence, accelerate your career, and master the world of tech product development.
Thank you for reading :)
If this piece made you pause, reflect, or even jot something down for later, that’s the kind of work I love creating.
I live and breathe this stuff. If you’re passionate about the intersection of data, product, and strategy, let’s connect on LinkedIn and continue the conversation.