
Feature Scaling Explained: The Secret Sauce Behind Smarter Machine Learning Models
Unlock the power of Min-Max and Z-Score scaling to boost your model’s accuracy and speed. Discover why most beginners overlook this simple yet game-changing step!

Feature scaling is a crucial pre-processing step in many machine learning workflows. It ensures that different features (variables) are on a comparable scale, which can significantly improve the performance and convergence speed of many machine learning algorithms.
Among the various methods of feature scaling, Min-Max Scaling and Z-Score Scaling (Standardization) are two of the most commonly used techniques.
Let’s do a deep dive into these two methods, their differences, applications, and implications.
What is Feature Scaling?
In a dataset, features can have wildly different units and ranges. For example, consider a dataset with two features representing a person’s age (ranging from 0 to 100) and their annual income in thousands (ranging from 0 to 1000).
If we feed these features directly into certain machine learning algorithms like logistic regression, gradient descent-based methods, or k-nearest neighbors, the algorithm may be biased toward the feature with the larger numerical range.
Feature scaling transforms features to a common scale without distorting differences in the ranges of values.
Min-Max Scaling (Normalization)
What is Min-Max Scaling?
Min-Max Scaling, also called normalization, rescales the range of features to a fixed range—most commonly from 0 to 1.
The formula for Min-Max scaling for a feature value xx is:
where:
x min is the minimum value of the feature in the training data,
x max is the maximum value of the feature in the training data,
x′ is the scaled value.
How Min-Max Scaling Works?
Imagine you want to normalize the age feature for people ranging from 18 to 65 years old:
Minimum (age) = 18
Maximum (age) = 65
A 30-year-old’s normalized age would be:
So, a 30-year-old's age is scaled to about 0.255 on a 0 to 1 scale.
When to Use Min-Max Scaling?
When your data does not contain many outliers.
When you want to preserve the original distribution's shape.
Good for image processing and neural networks where inputs need to be bounded between 0 and 1 for stable learning.
Use in algorithms that do not assume any distribution of data but are sensitive to the range of data, such as k-nearest neighbors (KNN) or support vector machines (SVM).
Advantages
Keeps all features in the same bounded range (usually 0 to 1), which can be helpful for certain algorithms and interpretable metrics.
Maintains the distribution shape (does not change data distribution).
Limitations
Sensitive to outliers since the min and max values can be distorted by extreme points.
If a new sample during prediction has a feature value outside the original min or max range, it can result in out-of-bound values (less than 0 or greater than 1).
Z-Score Scaling (Standardization)
What is Z-Score Scaling?
Z-Score Scaling rescales the feature so that it has a mean of 0 and a standard deviation of 1. This process is also known as standardization.
The formula for Z-Score scaling is:
where:
μ is the mean of the feature values (from training data),
σ is the standard deviation of the feature values,
x′ is the standardized value.
How Z-Score Scaling Works (Example)
Using the age feature example again, suppose the ages in your data have:
Mean μ=40
Standard deviation σ=10
For a 30-year-old:
So, the 30-year-old's age is 1 standard deviation below the mean.
When to Use Z-Score Scaling?
When your data contains outliers, as this method is less sensitive to them than Min-Max scaling.
When features are assumed to follow (or do roughly follow) a Gaussian (normal) distribution or when your model assumes normalized data.
Algorithms like linear regression, logistic regression, principal component analysis (PCA), and most gradient descent optimizations benefit from this.
When it’s critical to have features centered around 0 for mathematical simplicity.
Advantages
Less sensitive to outliers compared to Min-Max scaling.
Centers the data distribution, which can help many ML models converge faster.
Suitable for datasets with unbounded ranges.
Limitations
The transformed data doesn't have a fixed bound; values can go below or above any number.
If the feature’s distribution is heavily skewed, the standardization might not be as effective.
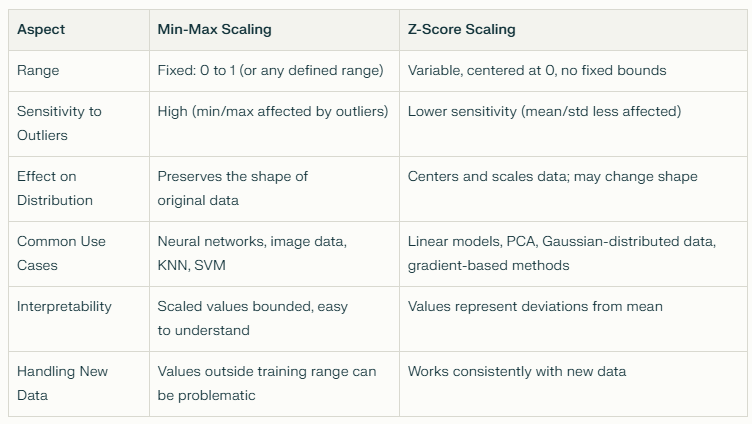
Comparison and Contrast: Min-Max vs. Z-Score Scaling
Practical Considerations
Always fit the scaler only on the training data, then apply the transformation to both training and test datasets. This prevents data leakage that skews model evaluation.
Min-Max scaling is straightforward but can lead to issues if your test or new data has feature values outside the training range.
Z-score standardization can be better for models requiring normally distributed inputs or when features vary widely with outliers.
Some algorithms (like tree-based models—decision trees, random forests, gradient boosting) are generally scale-invariant and don’t require scaling.
Netflix and Feature Scaling
Netflix uses machine learning to recommend movies and TV shows. The features fed into their model might include numeric data like user ratings (1 to 5 stars), watch duration (seconds), and user age (years).
Because these numbers differ vastly in their scale, feeding them raw into certain models could bias learning.
Min-Max scaling could be used to bound features like ratings into 0-to-1 range. But for more complex models sensitive to data distribution, Z-score scaling helps bring all numeric features to a common baseline.
Spotify and Z-Score Scaling
Spotify’s song features like tempo, loudness, and danceability vary in their scales and sometimes follow normal distributions.
They use standardization to normalize these so that the model doesn’t treat loudness (which could be negative dB values) disproportionately higher than tempo (beats per minute).
Summary
Min-Max Scaling rescales features into a fixed range, commonly 0 to 1, preserving data distribution shape but highly sensitive to outliers.
Z-Score Scaling (Standardization) centers features to mean zero and scales to unit variance, is more robust to outliers, and assumes (or benefits from) roughly normal distributions.
Choosing between them depends on your dataset, algorithm, and goals.
Proper feature scaling helps learning algorithms perform better and converge faster.
Understanding feature scaling is fundamental to mastering data preparation for machine learning and data science.
It’s like tuning your instruments before a concert—if each instrument (feature) is out of tune (scale), the music (model) won’t sound right. But with proper tuning, everything harmonizes beautifully, and your model can learn and perform at its best.
If this piece made you pause, reflect, or even jot something down for later, that’s the kind of work I love creating.
You can also support my writing through Buy Me a Coffee — only if you want to and can. And if you’d like to keep the conversation going, you’ll always find me on LinkedIn.
Thank you for reading.